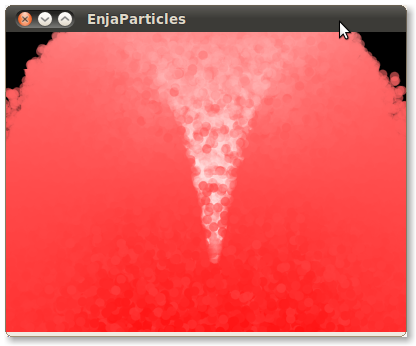
And so I reach another milestone in my journey to put OpenCL Particles in Blender! I’ve written my own (very) simple particle system from scratch in C++ using OpenGL and OpenCL, taking advantage of VBO interoperability. OpenCL and OpenGL interop is all about keeping the processing on the GPU, so the array of vertices you are drawing from and the array of vertices you are moving around are actually pointers to the same spot in GPU memory. This saves lots of time, especially if you are manipulating millions of particles in real time and you don’t want to transfer megabytes of data back and forth each frame!
I based my work on the NVIDIA GPU SDK example oclSimpleGL, but I wanted to make my code a standalone library that could be popped into some other graphics context (namely Blender). I was able to nicely separate my code into relevant files: opencl.cpp for opencl functions, enja.cpp for all the particle stuff and main.cpp is responsible for the window/GLUT and rendering stuff. Instantiating an EnjaParticles class creates a system and populates two VBOs, one for vertices and one for colors as well as an OpenCL context and all the necessary OpenCL variables. All one has to do is call the update function and the OpenCL kernel is executed, automatically updating the vbos which can be rendered by OpenGL. Right now the constructor for the particle system only takes in an array for vertices (which I intend to get from a DerivedMesh object in Blender) and makes the VBO ids available so the rendering context can use them.
The code currently compiles and runs on both Ubuntu with NVIDIA drivers on a GTX480 (yeah baby!) and my Macbook Pro with NVIDIA GeForce 9400M (it shouldn’t be hard to port to windows but I don’t have time for that now). I use CMAKE so check out the README to make sure you configure your environment correctly (you need to set up a couple environment variables so it can find the right headers to include and libraries to link against). In the CMakeLists.txt file you can also turn GL_INTEROP on and off if you want to see the performance difference. This code also runs in the OpenCL Visual Profiler, which wasn’t the easiest thing to get working. You need to be very careful not only with the OpenCL objects you instantiate, but ones that implicitly get created by calling cl functions! Once it works it’s very nice for seeing how your code is behaving on the GPU.
I’ve noticed that on my MacBook Pro the GL/CL interop is not behaving as expected, and I suspect that there is still memory being transfered. Without the opencl profiler I will have to do my own timings to get to the bottom of this. Adding to my suspicion is that there is no difference in performance for the oclSimpleGL example on my MBP.
It took me over a week to get this working like I expected to, I don’t intend it for it to take that long to get it into Blender. I really want to start working on interesting stuff like Rigid Body collision and python interaction, let alone more complex physics!

Sick… Now you’re going to port this to the Android right?
if(life[i] <= 0.)
You might be able to generalize this code (maybe shuffling some code to/from the host) to omit this conditional, and it would probably perform better.
Pingback: Tweets that mention Simple Particles with OpenCL and OpenGL | enj -- Topsy.com
awesome!!! cant wait to see it in Blender. Thank you for your hard work
@Nathan: It’s a safe bet that OpenCL will make it to phones eventually!
@Brian: Thanks for the tip! I definitely want to try some more fun stuff with the system, I know there is a more clever way to deal with the lifetime but I was too busy getting things to work properly. From my preliminary understanding one wants to avoid conditionals if possible right?
@enj: Yeah, you want to avoid conditionals for GPU targets since the compilers usually have all of the workgroups execute the computation for both branches and only end up using the conditional expression to decide which results get written back to memory.
You mentioned you didn’t get any performance increase on your MBP. One cause of this may be that your video card is using shared memory. It is not uncommon for laptop video cards to use part of main memory as video memory. Typically they will have about half dedicated and half shared. You may want to check your MBP’s specifications to find out the details and whether or not it uses shared memory.
@Brian: that makes sense, thanks!
@Andrew: thank you for pointing that out! I have the 9400M which a quick googling reveals does use shared memory (all 256mb =\ ). It’s kind of a let down, but it’s a reality check!
OpenCL reports that the card supports OpenGL interop, and the code still works but I guess the memory is being transfered by the underlying system. When I get good timings I should be able to confirm this.
Turns out that it was glFinish() taking up the time that made us think there was memory copying. Changing the timings we get much more expected results: rendering takes up the most time, followed by kernel execution (both are dependent on size) while acquiring and releasing OpenGL objects is cheap and does not appear to depend on the size of the arrays!